


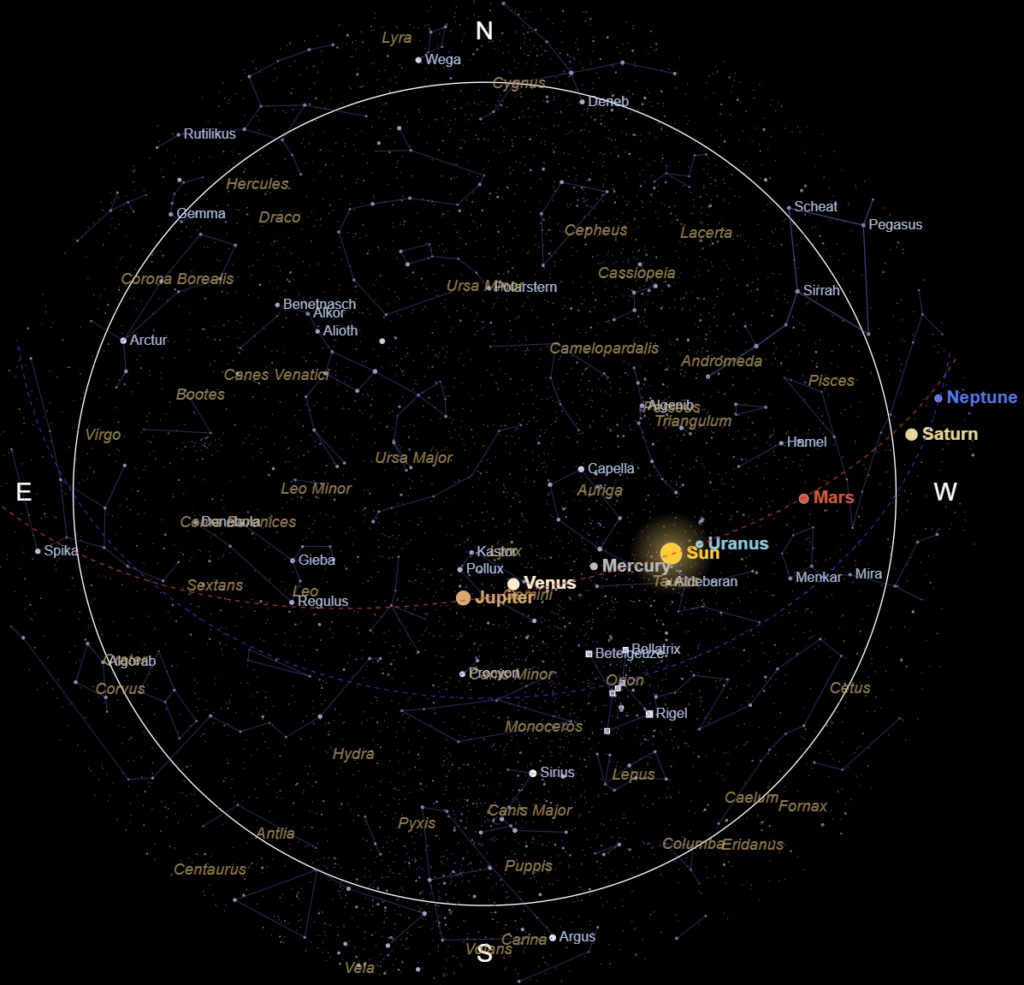
How a student project for Prof. Gerhard Fasching at the Technische Universität Wien — written in C for Windows 2.1 sometime around 1989 — found its way, more than three decades later, into a modern React application that anyone can open in a browser.
→ Open the live app at heeroz.com/stars
Vienna, late 1980s
I was an Electrical Engineering student at the Technische Universität Wien in the late eighties and early nineties — the era of MS-DOS, the first 80386 machines, and a fragile early Windows whose version number had only just ticked past 2. The Internet, for most students, was a rumor about something called USENET that the lucky ones could read on a VT220 in the basement of the Freihaus.
One of the most memorable lecturers of that period was Prof. Gerhard Fasching. He taught material science, a key subject for all EE students, with the kind of personal fervor that you remember even decades later, but his real passion was astronomy. He wrote books about it. Beautiful, careful books. The kind that put the constellations in their proper place not just on the sky but in cultural and scientific history. His “Sternbilderkunde: Himmelskarten, Himmelskörper, Sternbilder” sits on a lot of Austrian bookshelves to this day.
If you’ve ever had a professor whose enthusiasm for a topic was contagious enough to nudge you into spending an entire summer on a project that wasn’t strictly required, you know what I mean. For me that project was Stars.
The assignment that became a small obsession
I was looking for a way to earn academic credits and Prof. Fasching wanted a piece of software that could draw the night sky for any place on Earth, at any moment in time, in a way that he could actually use — to illustrate his lectures, and eventually to make the diagrams in his publications.
This was Windows 2.1, and shortly after Windows 3.0. There was no GDI+, no DirectDraw, no GPU. There was a 16-bit operating system on top of MS-DOS, a tiny set of GDI calls, and the unforgiving rule that every single data structure had to live inside a 64-kilobyte segment.
That last constraint is the one that defined everything else.
The 64k problem
The data set the app needed was the Yale Bright Star Catalog — roughly 9,000 stars down to about magnitude 6.5, with right ascension, declination, and magnitude for each one. The “obvious” representation is something like:
struct Star {
    double ra;     // 8 bytes
    double dec;    // 8 bytes
    float  mag;    // 4 bytes
};                 // = 20 bytes per star
9,000 stars × 20 bytes = 180,000 bytes. About three times what a 16-bit segment could hold. Game over.
So the records got squeezed. Hard.
- Right ascension goes from 0 to 2π radians. Scale it to a 16-bit unsigned integer and you have a resolution of about 0.0001 radians — well below the size of a printed dot on any screen of the era.
- Declination goes from −π/2 to +π/2. Offset it to start at the south pole and scale it the same way: another 16 bits.
- Magnitude needs maybe 6 bits if you quantize in steps of 0.25 — plenty for a chart.
That gave a record like this:
struct Star {
    uint16_t raRaw;     // RA  = raRaw  * 0.00009584 rad
    uint16_t decRaw;    // dec = decRaw * 0.00009584 - π/2 rad
    uint8_t  magByte;   // mag = magByte * 0.25 (lower 6 bits)
};                      // = 5 bytes per star
9,000 stars × 5 bytes ≈ 45 KB. That left almost 20 KB of breathing room in the segment for constellation line tables, object indices, and a bit of working memory. The packing constants DECLEH = 0.00009584 and MAGNEH = 0.25 outlived everything else in the codebase — they’re still in the React version today, exactly as they were in the C of 1989.
It’s a small reminder of how much of early personal-computer software was really about negotiating with the hardware. The constellation lines were stored as pairs of 16-bit indices into the star array, four bytes each. The screen projection ran in fixed-point in the hot loop. None of that mattered to the user — they just saw a sky. But the design of the data file rippled through every part of the code.
Drawing the sky
The core of the app is the projection from the celestial sphere onto a flat screen. For a chart that looks like the view from a particular spot on Earth at a particular moment, you need to convert each star’s right ascension and declination into the observer’s azimuth and altitude. The trick is the local sidereal time, which tells you which slice of the sky is overhead right now:
LST = (1.002737909 · days_since_1900 + 0.274907) · 24h  (mod 24h)
    + local_time / 0.997269566 − longitude
Once you have LST you can compute the altitude h and azimuth A of any star with the standard horizon-coordinate transform:
sin h = sinφ · sinδ + cosφ · cosδ · cos(LST − α)
where φ is the observer’s latitude, δ the star’s declination, and α its right ascension. Project (h, A) onto a disc and you have the chart. Repeat for 9,000 stars, sixty times a second… well, not in 1989. Once per redraw was plenty.
From lecture-hall projector to printed page
What I didn’t quite expect was that Prof. Fasching wouldn’t just use Stars in his lectures — he started using its output as source material for his books. The clean line drawings of constellations that appear in his “Sternbilderkunde” volumes are, in a real sense, descendants of those 5-byte star records. For a student, seeing your code in the figures of a published academic book is a fairly intoxicating feeling, and one I never quite forgot.
The custom constellation files in the modern version still carry that history. There’s a FASCHING.KBI file alongside the standard set, holding the line work Prof. Fasching himself preferred — a slightly idiosyncratic take that emphasizes certain figures over the IAU defaults. It’s there because it was on the original disks, and it would feel wrong to lose it.
2026: a port to React
Fast-forward roughly 35 years. The C source still compiles, in a fashion, but Windows 2.1 hasn’t been a meaningful runtime in a very long time. I asked Claude (yes — the model that’s writing this very paragraph) to port the application to a modern environment. The goal was simple: keep the look, the math, and the data files exactly as they are, but make it open in any browser, on any device (to be fair, it is not optimized for mobile devices and works best on a desktop screen).
The new version is a single-page React + Canvas application. It loads the original STARS.BIN, OBJECTS.BIN, and CONTOUR.BIN files directly — no conversion step, no re-encoded JSON. The packing constants are unchanged. The projection math is a near line-for-line translation of the old C, with two notable additions:
- Planets and the Sun, computed from the JPL approximate orbital elements (valid 1800–2050 to about arc-minute accuracy). Each frame solves Kepler’s equation E − e sin E = M by Newton iteration.
- IP-based geolocation so that when you first open the page, the chart is already centered on your latitude and longitude. The original always opened on Vienna; the new one starts wherever you happen to be.
Everything else — the horizon disc, the cardinal directions, the dashed ecliptic and equator, the click-to-query star info, the constellation editor — is the same set of features the original Windows app had, just in a layout that suits a modern screen.
A short user’s guide
Getting your bearings
When you open heeroz.com/stars, you’ll see a black disc with stars on it. That disc is your local sky, projected as if you were lying on your back looking up. N is at the top, S at the bottom, and east is on the left and west on the right — because that’s how the sky actually looks when you’re facing south and tilt your head back. (If you’re in the southern hemisphere, the chart still works; just face north and reverse the mental image.)
A small line of text in the upper-left corner shows the date, time, latitude and longitude that the chart is drawn for.
The toolbar
Along the top you can toggle the visible layers:
- Stars, Objects (deep-sky markers), Constellation lines, Star names.
- Sun and Planets — drawn at their actual positions for the chosen instant.
- Horizon (the white circle), N-S-E-W labels, Ecliptic (red dashed), Equator (blue dashed), and the Text overlay.
You can also pick the field of view from a row of preset buttons — anything from a wide 180° all-sky view down to a narrow zoom on a single constellation. Note that can you change the field of view in discreet steps with the mouse wheel, too.
The Settings panel
Open Settings on the side panel to control:
- Maximum magnitude — the dimmest stars to show. 6.5 is roughly what a person sees on a dark night; 4 looks like a city sky.
- Star size scaling — how aggressively brighter stars are drawn larger than dimmer ones.
- Field of view in degrees, if you want something other than a preset.
- Latitude and longitude — your location. In this app, negative longitude is east (an old astronomical convention the original code used; the modern version keeps it for fidelity to the data). Note that by clicking and dragging, you can change your location with the mouse. While in drag mode, a small map shows your current location.
- Time zone meridian — which meridian your local clock is referenced to.
- Date and time — any moment from the early 19th century through 2050 or so works fine. A Use Current Time button sets it to now.
Star Query
Click on any star in the chart. The Star Query panel shows its name (where one is recorded), Bayer/Flamsteed designation, parent constellation, catalog number, right ascension in hours, declination in degrees, and apparent magnitude.
The Constellation Editor
One of Prof. Fasching’s favorite features in the original: you can edit the line drawings yourself. Open the Constellation Editor, then right-click two stars in succession. The panel shows the pair and offers an Add Line or Delete Line button depending on whether that link currently exists. Your edits are persisted in the browser, so the constellation set you build up is yours, kept across sessions.
If you want to start from a different baseline, the Load Constellation section lets you pick from the original .KBI files — including FASCHING.KBI, the one Prof. Fasching himself maintained, and KOMPLETT.KBI, the densest, most exhaustive version.
Animation
The Animation panel can advance the sky in two different ways:
- Time mode runs the clock forward (or backward) at a multiple of real time. At “1 hr/s” you watch a full night go by in about thirty seconds — the stars wheel around the pole, planets drift, the ecliptic tilts.
- Longitude mode keeps the clock fixed and sweeps the observer eastward or westward around the globe. It’s a fast way to see how the same instant looks from very different places on Earth.
Negative speeds run things backwards. A small world-map overlay appears while you drag the chart, so you always know where on Earth you currently are.
View Variables
For the astronomically curious, the View Variables panel exposes the intermediate quantities used by the projection — days since 1900, Greenwich and local sidereal time, the observer’s longitude in hours, and so on. It’s the same set of values that the original C version printed in debug mode, more or less verbatim.
Stars: Eclipses, Messier Objects, and Two Bugs from 1992
A day of changes to the browser version of Stars — some of them new features, some of them corrections to arithmetic that had been quietly wrong since the Cold War ended.
→ Open the live app at heeroz.com/stars
Sharing a view
Every setting that defines what you are looking at — date, time, location, field of view, magnitude limit, which layers are visible, and whether an animation is running — now encodes into the address bar. The new Share button hands you a link that reproduces your exact scene on someone else’s screen, animation and all.
There is one small piece of etiquette built into it. If you open somebody’s link and then start changing things — dragging to a new location, zooming, toggling a layer — the parameters that your action invalidates quietly drop out of the URL. A link should describe what it actually shows. The moment it stops being true, it stops claiming to be.
Printing
The new Print button renders the current chart to a separate, square, high-resolution canvas and opens it in a print window with a caption giving date, location, and field of view.
Printing a white-on-black star chart onto white paper is a good way to empty a toner cartridge, so the print view uses its own palette: transparent background, solid dark stars sized by magnitude, and darker, heavier lines for the horizon, ecliptic, equator, and constellation figures. Internally there is now exactly one renderer that takes a colour theme as a parameter, rather than two drawing routines that could drift apart.
Rendering to a square canvas also means the horizon circle is a true circle regardless of the shape of your browser window.
A quieter toolbar
The row of toggle buttons had grown to about twenty. The display toggles now live in a single Objects dropdown, and the field-of-view buttons in an FOV dropdown that shows the current value. There is also a new Location Map option that keeps the little world map permanently on screen, rather than only while you drag.
The Sun and Moon, to scale
This is the substantial one.
The Sun and Moon had been drawn as fixed dots of 9 and 8 pixels — a decorative choice, not an astronomical one. Two things were wrong with it. The disks never changed size as you zoomed, so at a 90° field of view they were roughly nine times too large. And the ratio between them was frozen at 9:8.
That second point quietly made a solar eclipse impossible. In reality the apparent sizes of the Sun and Moon are almost the same, and which one is larger changes as their distances vary over the year — the ratio swings between about 0.96 and 1.10. That it crosses 1.0 is the entire reason we get total eclipses (Moon larger) and annular ones (Moon smaller). With the Moon permanently pinned at 89% of the Sun’s width, it could never cover it.
Both bodies are now drawn at their true angular diameter, computed from their actual distance at the moment you are looking, and they scale properly with the field of view.
Where you are standing matters
Positions were being computed geocentrically — as seen from the centre of the Earth. For most purposes that is fine. For eclipses it is not, because the Moon’s parallax is about 57 arcminutes, or nearly two lunar diameters. That parallax is precisely what makes an eclipse total along a narrow track and invisible a few hundred kilometres away. Without it, everyone on Earth would see the same alignment, which rather misses the point.
The Moon’s position is now corrected for your position on the Earth’s surface, using an observer vector that accounts for the planet’s flattening.
What you see
The Moon is shaded by its illuminated fraction, so it darkens naturally as it approaches the Sun and goes to a solid silhouette when the disks overlap. Totality draws a corona. The status bar reports the circumstances for your location — Partial, Annular, or Total.
To actually watch any of this, two supporting changes were needed. The field of view now goes down to 0.5°, and a new Center dropdown locks the chart onto the Sun or the Moon instead of the zenith. That last one turned out to be nearly free: the projection has always been an azimuthal-equidistant map about the zenith, and the zenith is just a direction with a right ascension and a declination. Substituting a different direction re-centres the entire chart and nothing else had to change.
Two bugs, aged about thirty-four years
Checking the eclipse geometry meant checking the clock behind it, and the clock had problems.
The first was a timezone. The routine that computed sidereal time correctly converted your local clock to Universal Time. The routine that computed the Julian date — which drives the Sun, Moon, and planet positions — did not. It treated whatever was on your wall clock as though it were UT. The two halves of the program disagreed by the full size of your timezone offset: one hour in Vienna, six in Texas. Six hours is about 3° of lunar motion, or six full Moon diameters.
The second was more interesting. Greenwich sidereal time came from a compact expression built around days since 1900, inherited straight from the DOS original. Tested against a reference, it is accurate to about a hundredth of an hour for 1990 and 1992 — which is exactly when it was written and, presumably, exactly when it was checked. Outside that window it drifts. By 2024 it is off by 0.76°.
You would never notice this looking at a constellation. It is a fraction of the width of your thumb at arm’s length. But it is one and a half solar diameters, and it rotates the entire sky. It has been replaced with the standard series, which now agrees with the reference across the whole range from 1990 to 2026 — including reproducing the old values in the years where the old formula was right.
There is something clarifying about writing a feature that finally exercises code hard enough to reveal that it was never quite correct.
Polarstern becomes Polaris
The star name database was written in Vienna, in German, and had stayed that way. Nineteen names are now anglicised: Polarstern to Polaris, Wega to Vega, Atair to Altair, Kastor to Castor, Spika to Spica, Benetnasch to Alkaid, Arctur to Arcturus, and a handful of spellings that had drifted — Femalhaut, Acharnar — brought back to standard form.
All 72 German constellation names are now the Latin ones used on the chart itself: Großer Bär is Ursa Major, Walfisch is Cetus, Schlangenträger is Ophiuchus, Haupthaar der Berenike is Coma Berenices.
One record had its name and constellation fields swapped, and had done since 1993 — it claimed to be a star called “Pegasus” in the constellation “Markab”. It is Markab, in Pegasus, and now says so.
The Orion placeholder, and what replaced it
The app shipped with a small file called OBJECTS.BIN, drawn as hollow squares. It contained seven entries. Decoding them gives Rigel, Bellatrix, Mintaka, Alnilam, Alnitak, Saiph, and Betelgeuse — the seven brightest stars of Orion, already in the main catalogue and drawn twice.
The original C source explains it. The layer is drawn under a flag called IDM_PLANET. In 1992 the program could not compute planetary positions, so you were meant to type them in yourself for your observing date — seven slots for the seven planets. Somebody filled them with Orion as test data, and nobody ever took it out. It has been sitting in the distribution for thirty-four years pretending to be something it wasn’t.
Since the app now computes the planets properly from orbital elements, the slot was free. It holds the Messier catalogue: all 110 objects, at epoch J2000, drawn with the conventional star-atlas symbols — a dashed circle for an open cluster, a circle with a cross for a globular, an ellipse for a galaxy, a circle with four ticks for a planetary nebula, a square for a diffuse nebula.
Turn it on and the Virgo Cluster appears as the dense knot of ellipses it actually is, with M31 and its two companions over in Andromeda and the Sagittarius nebulae strung along the summer Milky Way.
A better world
The little location map had continents drawn as a dozen very rough polygons — Europe was three blobs. The coastlines have been redrawn at roughly 2–3° resolution, at double the pixel density: Hudson Bay, Florida and the Gulf, Baja California, the Horn of Africa, the Red Sea and the Persian Gulf, Scandinavia, India, the larger Indonesian islands, Japan, Madagascar, New Zealand, Greenland, and Antarctica. The Caspian Sea is a sea again.
One thing that is still not right
Honesty about limitations seems more useful than a clean list of features.
The eclipse geometry is now correct — the sizes, the parallax, the classification all check out. The ephemeris underneath it is not good enough to reproduce a specific historical eclipse. The Moon’s position uses a compact low-precision theory anchored at the end of 1999, and it drifts by roughly 0.85 arcminutes per year away from that epoch. Measured against five known new moons, the error runs from about −8 arcminutes in 1992, through essentially zero in 1999, to +20 arcminutes by 2024.
Twenty arcminutes is most of a lunar diameter. Set the app to the total eclipse of 8 April 2024 over northern Mexico and you get a convincing partial eclipse with the Moon sitting about one diameter off where it belongs. Everything around the answer is right; the Moon simply is not quite where the model says.
Fixing it properly means implementing a real lunar theory with several dozen periodic terms, rather than papering over the drift with a fudge factor fitted to five data points. That is a job for another day, and it is the honest reason there is no “eclipse finder” in this release.
All of this is live now at heeroz.com/stars. Set the field of view to 2°, centre on the Sun, and run the animation forward — the Moon really does come around.