

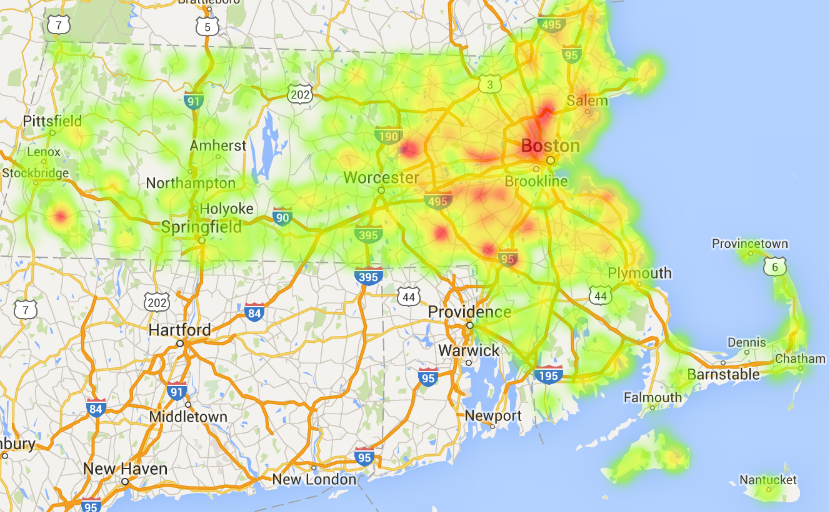
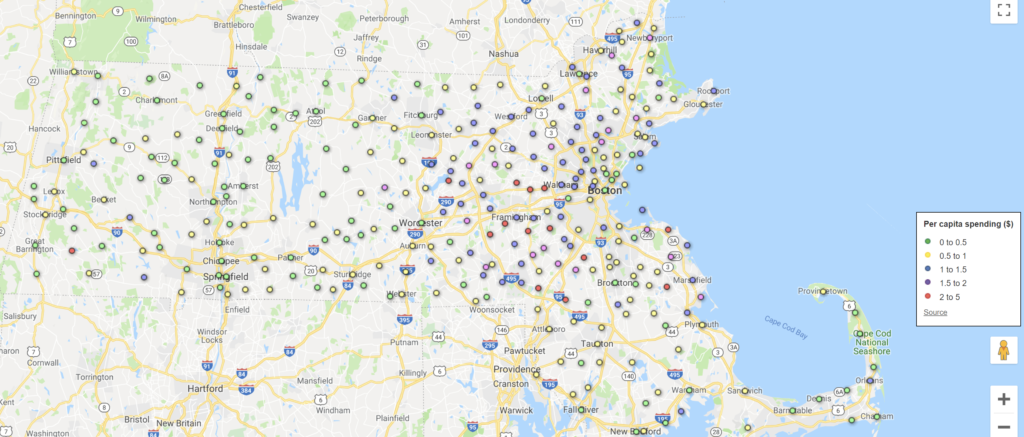
2019: Google is about to retire Fusion Tables, the tool that was used to geocode the data and create the maps. There is no direct replacement, and I will not recreate the maps with another tool.A high-level initial analysis of the Ashley Madison credit card transactions with a text editor and Excel revealed interesting geographical differences. I saw that the total amount spent in my town of roughly 12,000 residents surpassed the total spending of much larger towns in the region with 30,000 or 40,000 residents. This made me curious. I wanted to visualize the per-capita spending on a map. It took a new, more powerful computer until I was ready for this, and here are the results. In most Massachusetts municipalities, the per capita-spending over the period that Ashley Madison (AM) data was leaked (from 2008 through June of 2015) was well under $1. But some towns stand out with a per-capita spending of $3 of more. This adds up to tens or even hundreds of thousands of Dollars that were paid to AM by the residents of some towns. Overall, Massachusetts accounts for more than $6 million of Ashley Madison’s total revenues during this period, with Boston being the biggest spender in absolute numbers ($437,252.05), while Chesterfield and Goshen trail the pack with one $49 transaction each (I did not include towns with no spending at all). When I calculated these totals, I filtered by transaction type and included only settled credit card transactions. I did not have population data for neighborhoods and villages, another shortcoming of my approach. These zip codes are not included in the amounts, but their population is, including some of the larger ones like Wellesley Hills or Assonet. This makes the per-capita spending in towns like Wellesley and Freetown appear much lower than it actually is. The biggest shortcoming of the card transaction dump is that there is no currency information. This prevents us from comparing spending patterns between different countries. Massachusetts residents may have had foreign currency transactions on their credit card from when they traveled abroad. I saw some evidence that this happened (for example when the originating IP address was in Japan) and it can cause large errors. I briefly considered a ZIP code map of the highest and mean spending by a single person, but because of the currency issue, the results were misleading and I decided not to publish them.

Here is the top dozen:
|
Massachusetts towns with the highest per capita spending on Ashley Madison |
|
|---|---|
|
Monterey |
3.5545 |
|
Wrentham |
3.4538 |
|
Mansfield |
3.2881 |
|
Boylston |
2.8767 |
|
Cohasset |
2.8122 |
|
Hopkinton |
2.7281 |
|
Sherborn |
2.4755 |
|
Sudbury |
2.3806 |
|
Dover |
2.2676 |
|
Pembroke |
2.1915 |
|
Weston |
2.1501 |
|
Wayland |
2.0897 |
If there is a lesson learned from the story, then it is this: No matter how successful an online business is, chances are it started on a shoestring budget. I’d like to imagine that the AM site was built by a bunch of inept high school drop-outs who worked for little money but didn’t know what they were doing. I did not see any code, but the pieces that I looked at for this article, i.e. a portion of the database schema, the data itself and how it is accessed and stored, with its simplicity and yet full of inconsistencies, are worrisome. This was a business with $115 million in annual sales and virtually no overhead, mind you. There should have been cash around to review and audit the infrastructure and fix this stuff. If security was handled in the same lax way as the database schema, then one cannot be surprised that this happened. So, we basically have here a fly-by-night operation that hit a gold mine, but the owners were too greedy to properly reinvest into their infrastructure – an all-to-familiar plight. In a sense, they got what they deserved, but with unfortunate collateral damage. And the lesson for the rest of us is, never, ever, Ever! entrust even the tiniest scrap of personal data to such a business, no matter how professional they look. Never! There are thousands of others just like it still in operation, in every vertical you can think of.